
Research
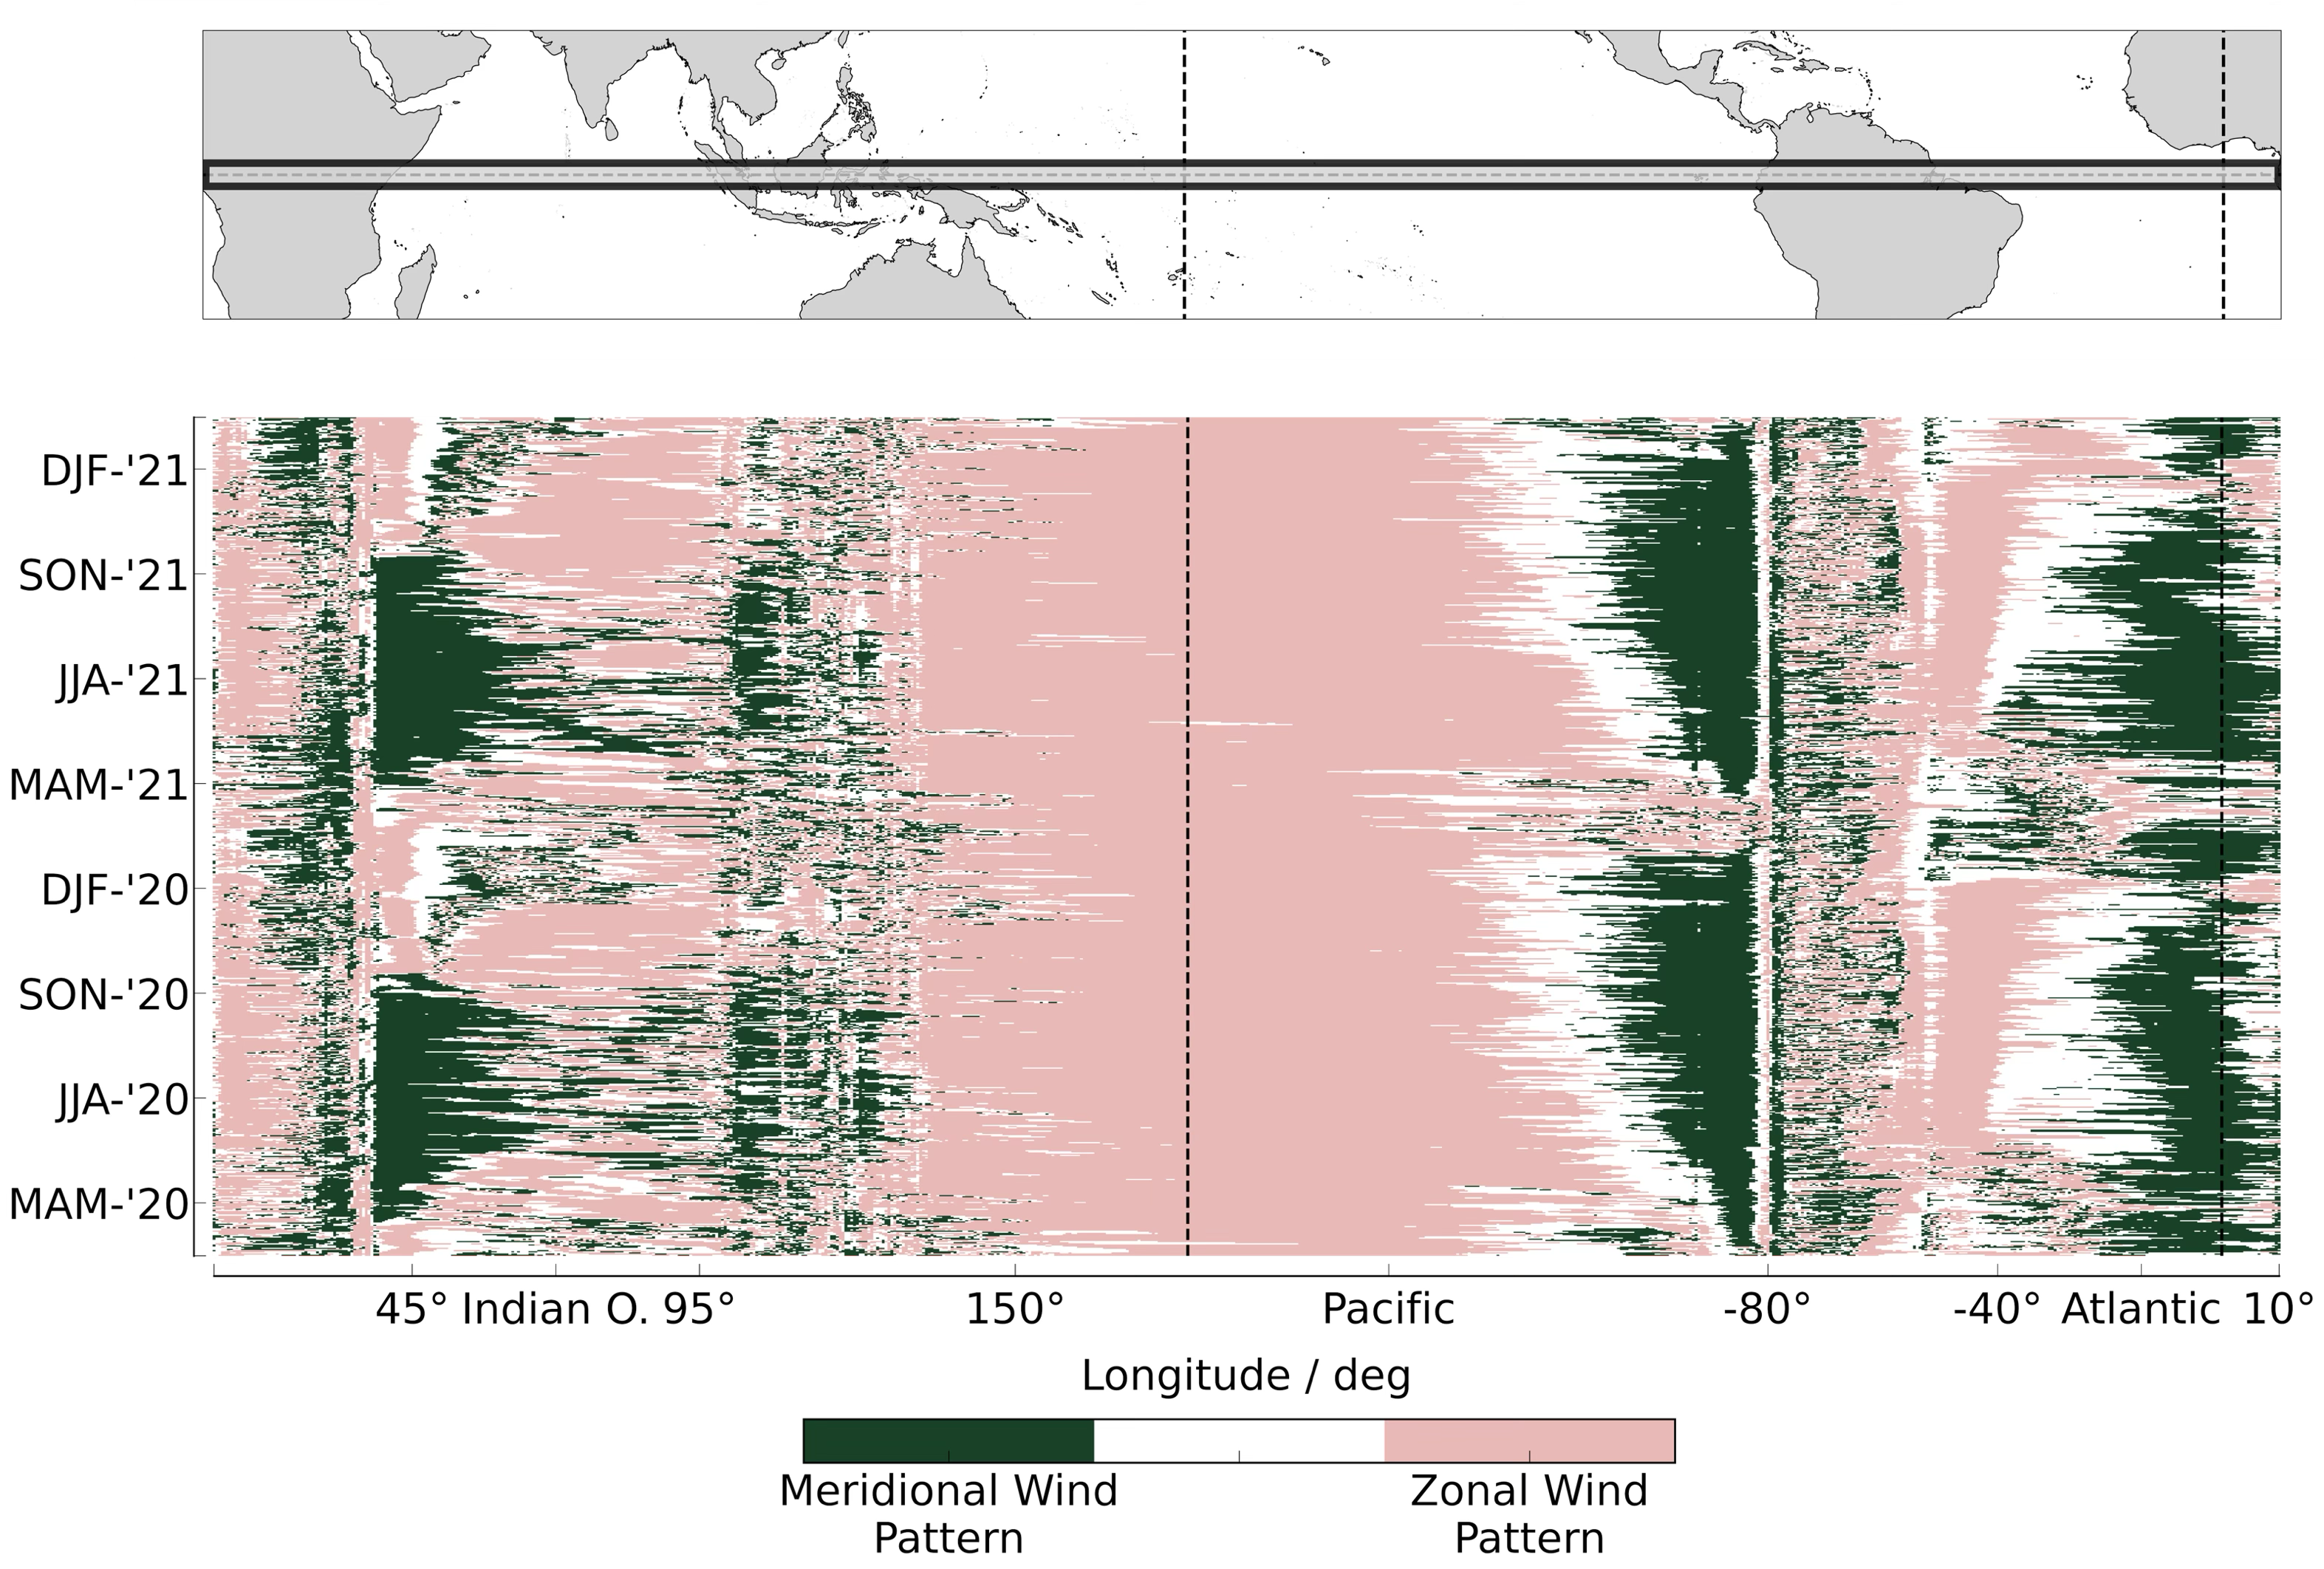
As part of my PhD research, I investigated the dynamics of surface winds over the equatorial oceans. The figure above illustrates two distinct wind patterns that prevail near the equator: the Zonal Wind Pattern, which flows parallel to the equator, and the Meridional Wind Pattern, which crosses it. Contrary to intuitive expectations, the winds cross the equator at nearly right angles in some regions. These areas are highlighted in green, representing the Meridional Wind Pattern.
On their journey toward the equator—originating from the higher latitudes where the trade winds descend from the Hadley cell—the momentum balance governing these winds undergoes a shift. Farther from the equator, an Ekman balance between the Coriolis force, pressure gradient force, and surface friction dominates. Closer to the equator, however, the Coriolis force vanishes, and the balance is instead shaped by the pressure gradient force, surface friction, and both horizontal and vertical momentum transport.
With the high resolution of the storm-resolving climate model ICON which operates at kilometer scale, we can capture these subtle contributions and quantify their role in shaping the equatorial surface wind momentum budget.
From the study at the top of this page, we learned how important the pressure gradient force is, which is largely shaped by the underlying sea surface temperature (SST).
In an atmosphere-only ICON simulation, I found that, despite prescribing an ideal SST distribution, the equatorial surface winds were, on monthly average, only about half as strong as those in ERA5, which I used as a reference.
This result was surprising at first, since in the earlier project I demonstrated that, following the approach of Lindzen & Nigam (1987), surface winds can be well approximated by the SST distribution alone.
By comparing ICON to the standalone COARE algorithm, which is based on observational data from the TOGA-COARE field campaign in the early 1990s, we find that while ICON reasonably simulates the momentum exchange, it permits far too little heat exchange.
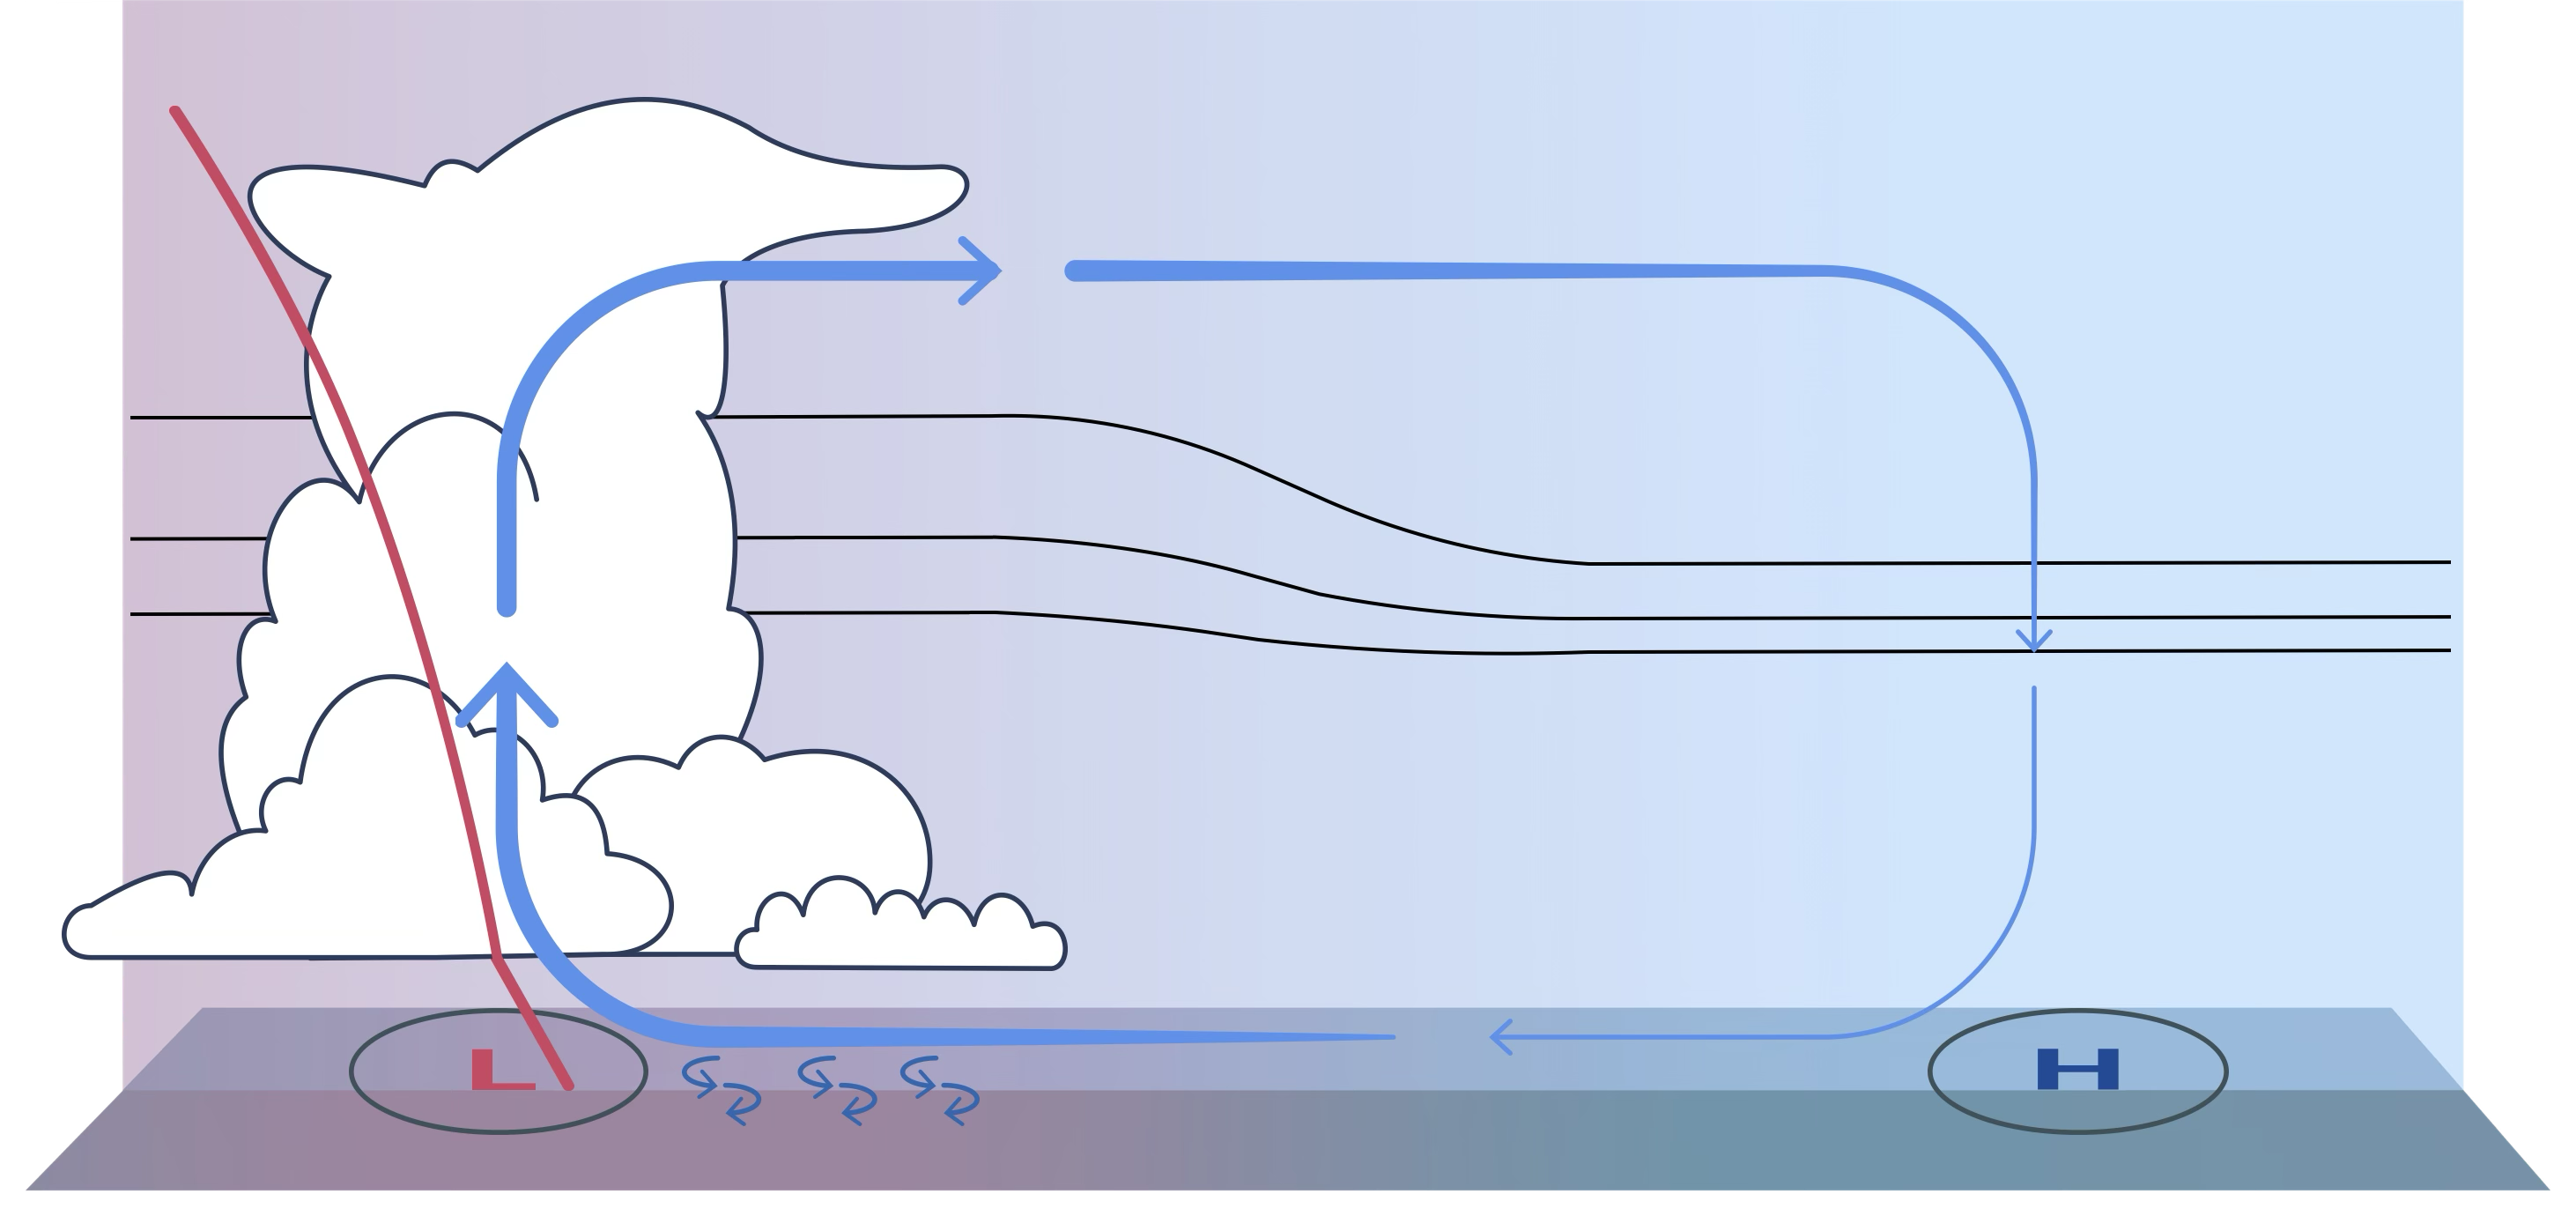
Through a sensitivity study, I show how strongly free-tropospheric winds respond to changes in heat exchange at the air-sea interface. Even small changes in surface heat fluxes can lead to enhanced deep convection, which initiates an overturning circulation which ultimately drives the surface winds.
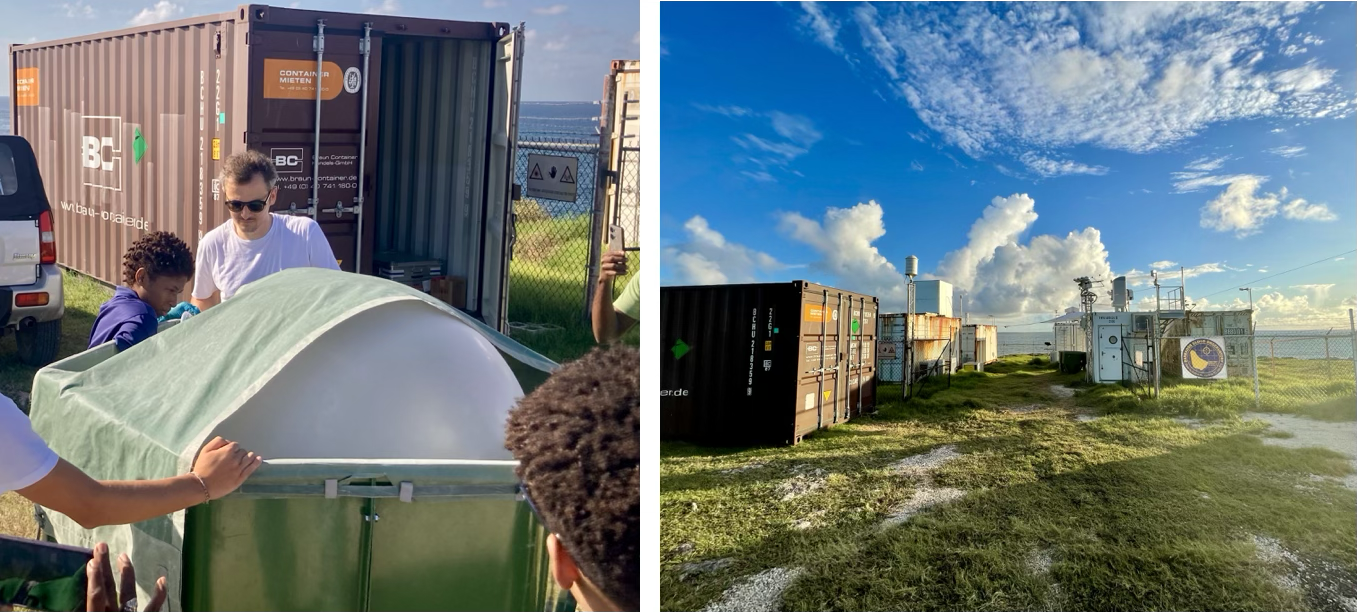
In 2024, I had the great opportunity to take part in the ORCESTRA field campaign. For four weeks, I led the radiosonde mission in Barbados, launching 141 sondes together with a team of 15 young scientists.
It was my first time in the tropics, and it was eye-opening to witness just how dynamic cloud and weather formation can be. Like bubbles rising in a glass of carbonated water, water vapor ascends, clouds form like raised index fingers above the transition layer and just as quickly, they rain down and vanish again.
Since returning to Germany, I’ve been post-processing the data from all radiosonde launches conducted at BCO (Barbados), INMG (Sal, Cape Verde), and the R/V Meteor. I am currently writing the data paper, which should be published this year but the dataset is already complete. After installing the IPFS client, you can run these two python lines to access the data:
ds = xr.open_dataset("ipfs://bafybeid7cnw62zmzfgxcvc6q6fa267a7ivk2wcchbmkoyk4kdi5z2yj2w4", engine="zarr")